On Population Density
Density is widely misunderstood. Here's a handy guide for understanding density and mapping it to the places you know.
Thesis Driven dives deep into emerging themes and real estate operating models. This week’s letter digs into the concept of population density, offering benchmarks and examples of how to compare population densities across regions and neighborhoods.
This is a free letter, so feel free to share it!
Real estate is the business of population density. Development, zoning, transit, retail, and more are all fundamentally intertwined with how many people are in a given place at a given time. Without sufficient population density, transit and retail fail, placemaking doesn’t work, and agglomeration effects are lost.
And many trends and correlations are simply artifacts of population density—see the obligatory XKCD below.

But population density is one of the most misunderstood concepts in real estate and urbanism. While conceptually simple—how many people are there in a given area?—boundaries and denominator effects can make many population density metrics pointless if not misleading.
For example, the city of Jacksonville, Florida has a population density of 1,288 people per square mile. That’s remarkably low density for a city, more appropriate for a low-density exurb and less than half the density of Palo Alto, California.
As it turns out, the City of Jacksonville’s legal borders span 875 square miles, more than half the size of Rhode Island. Within those hundreds of square miles are thousands of acres of swampland, forest, and low-density suburbs, dropping the city of Jacksonville’s official population density to the point of meaninglessness. (This is also why Jacksonville is Florida’s largest city despite being only it’s fourth largest metro area, and it’s not particularly close.)
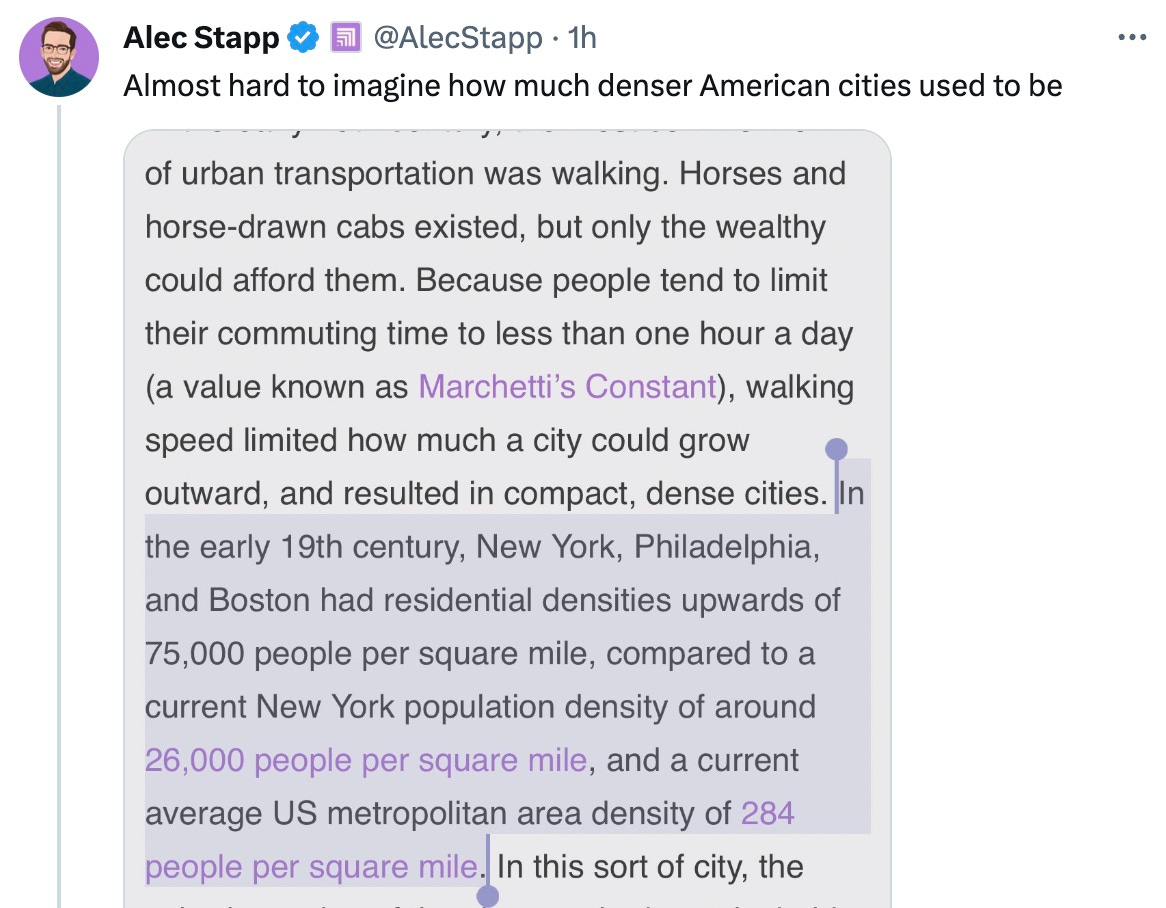
Even smart people make these mistakes. Consider this morning’s tweet from Institute for Progress co-founder Alec Stapp which reflects a misunderstanding of how population density works:
This is not an apples-to-apples comparison and demonstrates why citing population density numbers at a city level—particularly across time periods which saw changing municipal boundaries—is meaningless. NYC’s current population density is indeed 26,000 people per square mile. But that is an average density across all five boroughs including places like Staten Island and eastern Queens.
If the 75,000 per square mile number were indeed applied to an apples-to-apples geographic area, it would imply that early 1800s New York City had a population of 25 million, which would be surprising given that the entire US population in 1800 was 5.3 million people.
And for reference’s sake, the Upper East Side’s population density today is approximately 168,000 people per square mile.
In cities, population density is best considered on a neighborhood scale. The viability of retail and transit, the built environment, walkability, and the vibrancy of street life are dependent on neighborhood-level density. So when comparing urban areas, we’ll mostly look at specific neighborhoods and sub-markets rather than cities as a whole.
Of course, rural population densities matter too. The difference between 30 people per square mile and 300 per square mile is the difference between Uber working effectively—or not.
To help our readers get a “feel” for certain densities, let’s go through examples of each:
🏜️ Zero People Per Square Mile: Basically Uninhabited (0/km)
Very few if any people live in these areas. The only means of travel is by road, and even basic roads require subsidies to maintain.
Nullarbor Plain, Australia (0 people per square mile)
Wyoming (6 people per square mile)
🌳 10 People Per Square Mile: Low Density Rural (3.9/km)
Low density rural areas typically have small clusters of homes and towns separated by wide open spaces. Transit and rideshare services (like Uber and Lyft) are typically absent, and car ownership is required for day-to-day life.
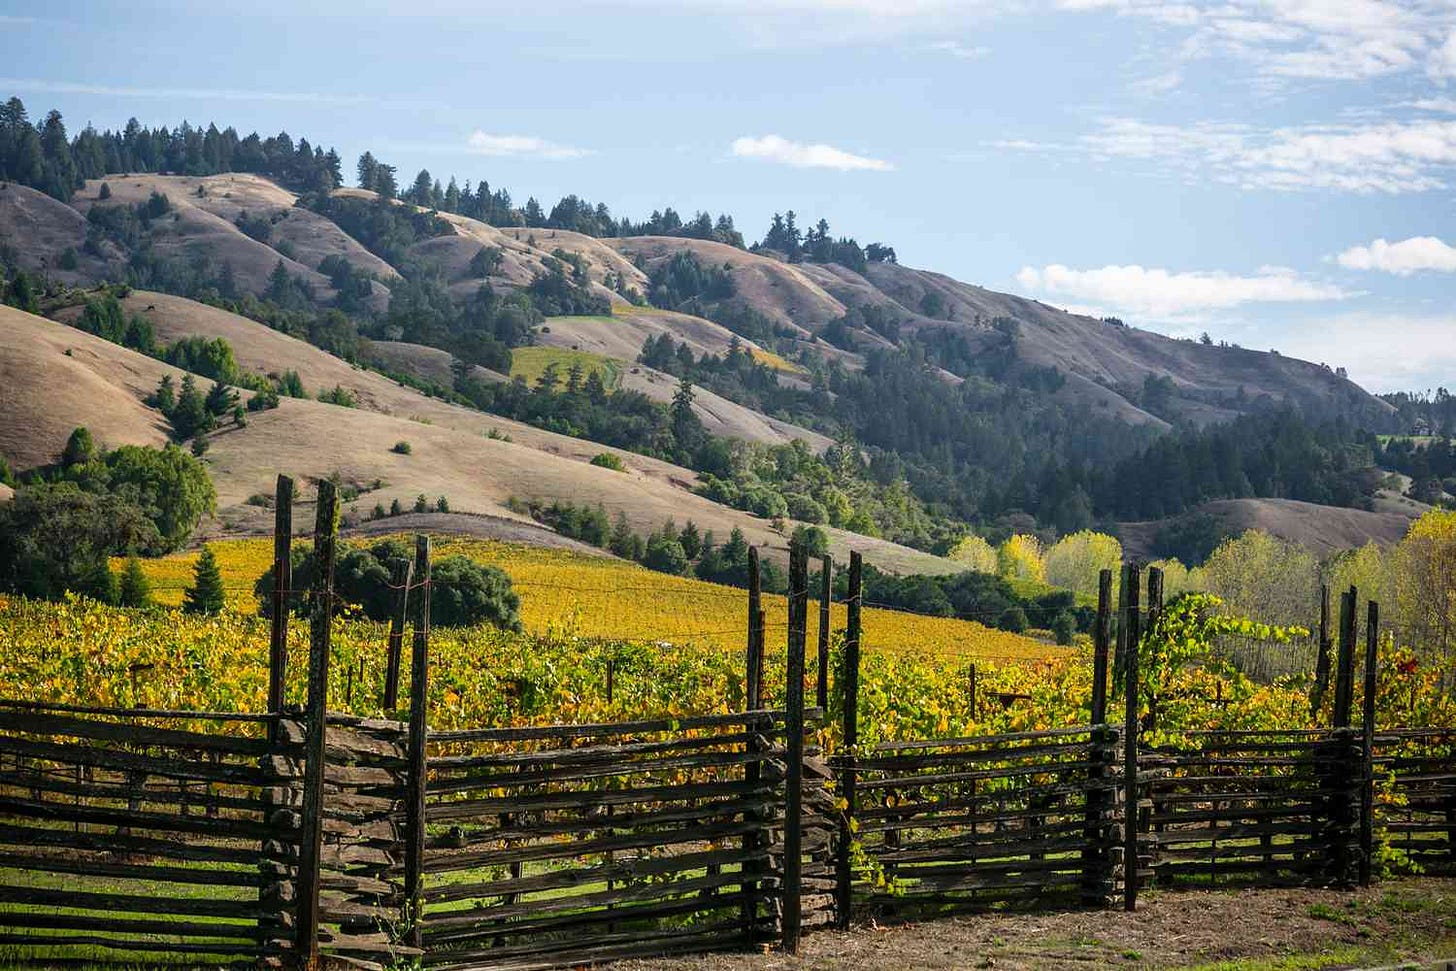
Mendocino County, California (26 people per square mile)
Lake District, UK (44 people per square mile)
Kerr County, Texas (45 people per square mile)—The center of the Texas Hill Country includes Kerrville and some nice Airbnbs as well as plenty of open ranch and farmland.
🌾 50 People Per Square Mile: Mid Density Rural (19/km)
Pinal County, Arizona (79 people per square mile)
Sullivan County, New York (81 people per square mile)
United States Average (96 people per square mile)—On average, the United States has the population density of a county in the rural Catskills. But that is the average of everything from vast, uninhabited stretches of the West to the densely-packed streets of Manhattan.
🚜 100 People Per Square Mile: High Density Rural (39/km)
A density of 100 people per square mile is typical of rural counties that may have mid-sized towns or developed areas combined with large stretches of farmland, woodland, or other undeveloped areas. While transit is likely sparse here—if it exists at all—this is the minimum population density required for ridesharing services to operate.
Whatcom County, Washington (102 people per square mile)
Berkshire County, Massachusetts (142 people per square mile)
Napa County, California (185 people per square mile
Nantucket, Massachusetts (308 people per square mile)
🏡 500 People Per Square Mile: Exurban & Low Density Suburbs (193/km)
Low-density suburbs begin around 500 people per square mile, which equates to one house for every three acres (and an average of 2.5 people per house). This level of density is common in exurban towns that may have a small, dense town center. A car is almost always required to live at this density.
Bernardsville, New Jersey (601 people per square mile)
New Jersey (1,263 people per square mile)—New Jersey is the highest-density state in the US. In the aggregate it is on par with a low-ish density suburb.
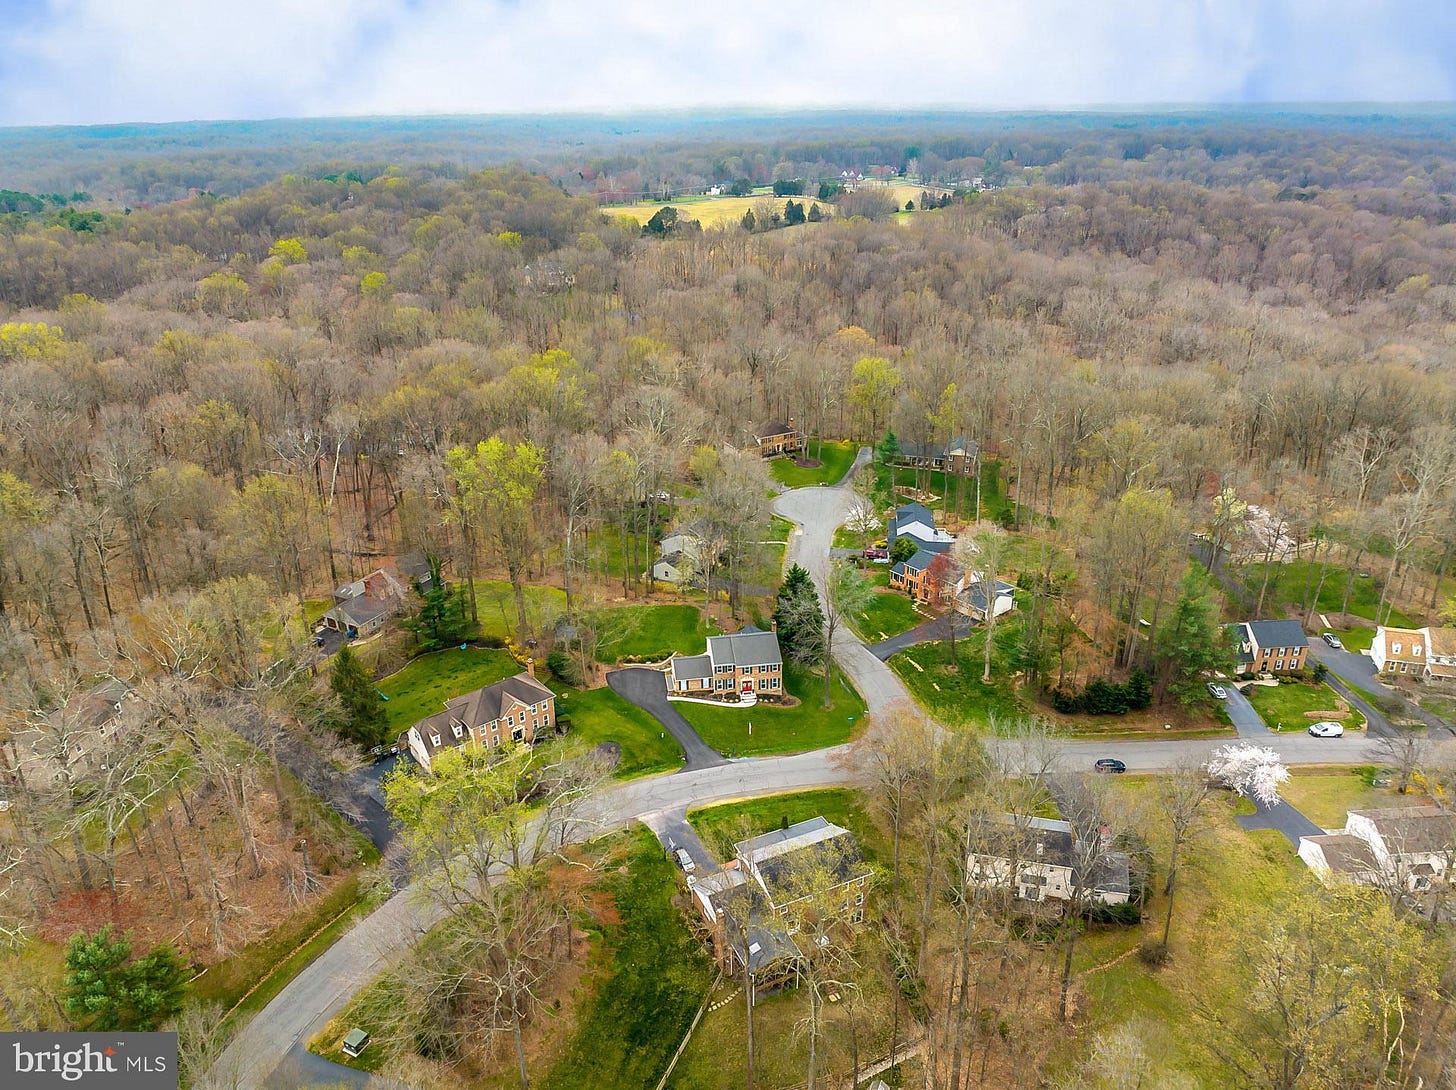
Fairfax Station, Virginia (1,323 people per square mile)
🏠 1,600 People Per Square Mile: Mid Density Suburban (618/km)
This density equates to one home per acre and the US average of 2.5 people per household: a typical suburb. When Americans think “suburbs”, this is the density that typically comes to mind. While a car is almost always required to live in at this density, some suburbs have denser, transit-oriented centers that enable car-free commuting.
Montgomery County, Maryland (2,154 people per square mile). In practice, Montgomery County is a blend of low-density exurbs and a few mid-density city centers like Bethesda, Silver Spring, and Rockville—so it’s useful as a reference point but not to get a realistic sense of what uses are viable in MoCo.
Alpharetta, Georgia (2,470 people per square mile)
The Woodlands, Texas (2,644 people per square mile)
Palo Alto, California (2,650 people per square mile)
🏘 3,000 People Per Square Mile: High Density Suburban (1,158/km)
A density of 3,000 people per square mile is common in higher-density suburbs with single-family detached homes on small lots. Studies show that this density can support infrequent bus service but little more. While some retail may be walkable, a car is typically required for day-to-day life.
La Jolla, California (3,304 people per square mile)
Mercer Island, Washington (3,886 people per square mile)
Orange County, California (4,025 people per square mile)
Tempe, Arizona (4,775 people per square mile)
Pasadena, California (5,703 people per square mile)
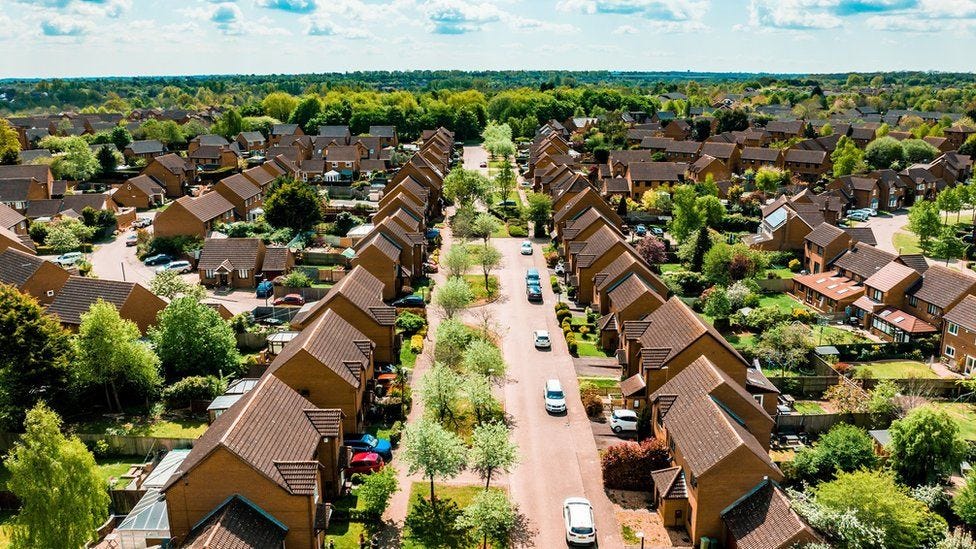
Milton Keynes, UK (7,460 people per square mile)
Staten Island, New York (8,112 people per square mile)
🚉 10,000 People Per Square Mile: Low Density Urban (3,861/km)
At 10,000 people per square mile, land use feels unquestionably urban. This is the density required for mass transit to work (Zupan and Pushkarev, 1977). It’s also the minimum density required for the walkable “15 minute city” to function and support the required density of retail and services.
Santa Monica, California (10,662 people per square mile)
Miami Beach, Florida (11,315 people per square mile)
San Francisco, California (17,237 people per square mile)
West Hollywood, California (18,226 people per square mile)
Cambridge, Massachusetts (18,512 people per square mile)
Old City of Toronto (21,065 people per square mile)
Kiryas Joel, New York (22,540 people per square mile)
🚉 25,000 People Per Square Mile: Mid Density Urban (9,653/km)
Transit becomes a necessity at 25,000 people per square mile. At this density, a number of buildings are likely to be low- to mid-rise multifamily dwellings. Walkable retail can be supported on all major corridors. But this density doesn’t necessitate high-rise development; many of the neighborhoods in the 25-50,000 people per square mile range feature 2-6 story dwellings.
Kensington and Chelsea, London, UK (31,000 people per square mile)
Brickell, Miami, Florida (33,407 people per square mile)—Brickell is one of the few neighborhoods in this category with a preponderance of high-rise residential towers.
Park Slope, Brooklyn, New York (45,100 people per square mile)
🌆 50,000 People Per Square Mile: High Density Urban (19,305/km)
At 50,000 people per square mile, high-rise buildings are common. Bus- or tram-based transit is no longer sufficient; heavier rail with frequent trains is required. Retail is ubiquitous and most necessities can be reached within a 5-to-10 minute walk.
Paris, France (53,000 people per square mile)
Jackson Heights, Queens, New York (62,800 people per square mile)—Jackson Heights and Paris are both notable in that they’ve achieved high population densities with very few residential towers. Rather, they have a consistent residential density of 3-to-6 stories.
Manhattan, New York (72,918 people per square mile)—While this may be a surprisingly low density given Manhattan’s skyline, it’s important to remember that plenty of those buildings are offices that house no people. Zip code 10022—which includes many of Midtown East’s skyscrapers—has a Manhattan-average density of 73,000 people per square mile despite its height.
Manila, Philippines (111,002 people per square mile)
Upper East Side, Manhattan, New York (168,000 people per square mile)—With its concentration of mid- and high-rise residential buildings, UES has Manhattan’s densest population despite not having its tallest towers.

Lalbagh Thana, Dhaka, Bangladesh (440,000 people per square mile)—Lalbagh Thana is considered the most densely populated neighborhood in the world. That’s one person every 64 square feet!
As data-driven real estate investing gains momentum, real estate investors and operators are increasingly looking to quantitative sources to inform their decisions. But some of the most basic information about a given place—how many people live there—is frustratingly misunderstood in the market.
Getting a “feel” for different densities will make it easier to tease out denominator effects and other data artifacts that can make population density numbers unreliable and misleading.
— Brad Hargreaves


